
Most tax-loss harvesting products ask you to trust the user interface.
HarvestEngine is trying to earn trust a different way: by making the algorithm itself worth inspecting.
That matters because tax-loss harvesting is not just a pretty dashboard problem. It is a portfolio-engine problem. The product has to decide which names to hold, when a loss is meaningful enough to act on, which replacement is close enough to preserve exposure, and how to do all of that without drifting into tax mistakes or hand-wavy black-box behavior.
What the engine actually does
What does the HarvestEngine algorithm actually do with a taxable portfolio at a high level?
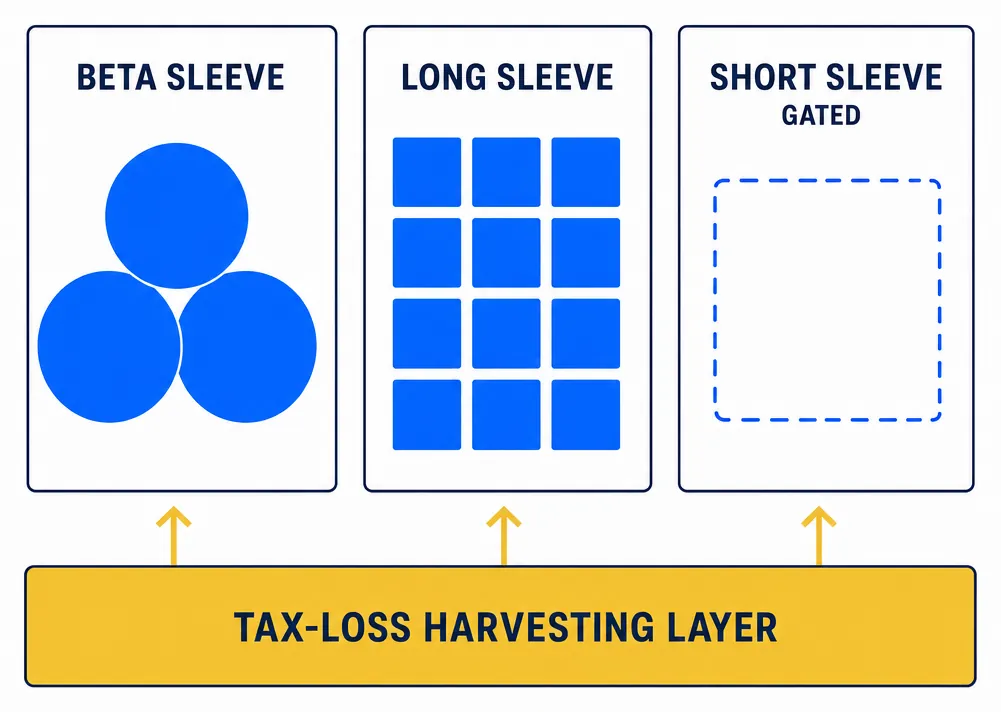
At a high level, HarvestEngine organizes the taxable account into three sleeves — beta, long, and an optional short — with a continuous tax-loss-harvesting layer running across them.
- Beta sleeve: broad-market ETFs (VOO, VTI, IXUS, BND, AGG) for cheap, efficient market exposure. Limited harvest surface but excellent tracking and simplicity.
- Long sleeve: the direct-index portfolio of single stocks tracking your chosen benchmark. The engine ranks the eligible universe with a four-leg composite model and this is where most of the harvest surface lives, because each stock can be harvested independently.
- Short sleeve, gated: an optional advanced overlay for users who want extra harvest surface and the ability to reshape risk without selling appreciated longs. Adds margin, borrow, and tax complexity, so it is opt-in only.
The tax-loss-harvesting layer watches existing positions across all three sleeves continuously, finds losses worth realizing, and swaps into the most similar wash-safe replacement. It is the behavior that ties the sleeves together — not a sleeve of its own.
That may sound abstract, so here is the practical meaning: the product is not randomly swapping one stock for another. It is using an explicit scoring and filtering system that can be explained line by line.
The long-side model is factor-grounded, not vibes-based
How does HarvestEngine score and rank stocks in the long-sleeve universe rather than just replicating an index?
Every stock in the chosen index universe gets scored on four legs:
- Value: how cheap or expensive the business looks using yield-based and balance-sheet-aware measures
- Momentum: whether the stock's medium-term trend is helping or hurting
- Quality: profitability, leverage, and margin strength
- Idiosyncratic volatility: how noisy the stock is after stripping out the general market move
The current production composite uses this weighting:
| Leg | Weight | Why it matters |
|---|---|---|
| Value | 25% | Prevents the engine from blindly hugging expensive names just because they are in the index |
| Momentum | 30% | Helps avoid stepping in front of obvious deterioration |
| Quality | 30% | Biases the sleeve toward stronger businesses |
| Idiosyncratic volatility | 15% | Penalizes the noisiest names after market exposure is removed |
This is one of the first reasons customers should care. The engine is not just trying to replicate an index cheaply. It is trying to build a better-behaved direct-index sleeve while staying inside benchmark shape.
The normalization is one of the real moats
Why does cross-sectional normalization within peer groups matter more than universal scoring thresholds?
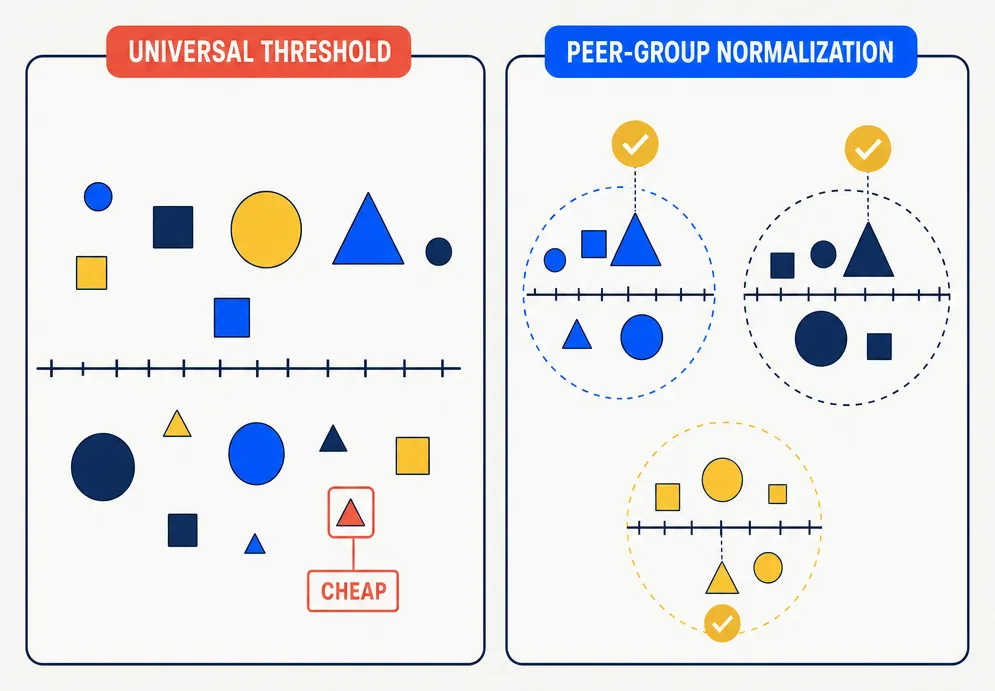
A lot of retail finance software uses universal thresholds that sound reasonable but fail in practice. A utility company should not be judged on the same raw scale as a software company. A valuation multiple or a profitability measure can mean different things in different sectors.
HarvestEngine fixes that by ranking metrics within the best available peer group first, then converting those ranks into normalized scores. In plain English: a stock gets judged against the right neighbors, not against the entire market at once.
Customers should care because this makes the engine less naive. It is one of the differences between generic screening logic and something closer to institutional portfolio construction.
The harvest trigger scales with the position
Why does a single fixed loss threshold misfire across positions of very different sizes?
Because a flat percentage and a flat dollar amount each break at one end. A flat 7% bar on a $200,000 position makes you wait for a $14,000 loss before acting; a flat $750 bar on a $3,000 position has you churning on almost any dip.
HarvestEngine uses a dynamic minimum instead: a loss has to clear the greater of a dollar floor and a percentage of the position's cost basis before it is worth harvesting — roughly the greater of about $750 or 7% of cost basis by default, both adjustable. Small positions are gated by the dollar floor, so the engine never churns on trivial losses; large positions are gated by the percentage, so the bar scales up with size. A short minimum holding period and a minimum trade size round out the gate.
That matters to customers because it reduces dumb churn — the engine harvests losses that are actually worth the round-trip, not every twitch in a noisy name.
The replacement logic is where trust is usually won or lost
How does HarvestEngine select a replacement after selling a losing position without tripping the wash-sale rule?
After a loss is detected, the product has to answer the hard question: what should replace the sold name so the portfolio stays aligned without tripping the wash-sale rule?
HarvestEngine scores candidates using a similarity model built from four pieces:
| Replacement dimension | Weight | Purpose |
|---|---|---|
| GICS business similarity | 40% | Keep the business and industry shape close — the cheapest way to preserve exposure |
| Factor conviction | 20% | Lean toward the higher-quality name when two candidates are otherwise close — a quality tilt, not a resemblance measure |
| Beta proximity | 15% | Keep market sensitivity close |
| Tracking-error fit | 25% | Directly estimate how far the stand-in would drift from the sold name, from their volatilities and correlation — it catches a volatility mismatch a plain correlation check misses |
Before ranking, candidates also have to survive a quality filter. If the candidate is in an earnings window, has just suffered an unusually bad short-term move, or carries other obvious warning signs, the engine can drop or penalize it.
"Unusually bad" is judged against the candidate's own volatility, not a flat number — a 3% weekly drop in a sleepy staple is a real warning sign, while an 8% drop in a high-flier is just an ordinary week. The screen rejects a candidate whose recent return falls below a volatility-adjusted floor:
floor20d = max(−25%, −2σ · √20)
Try lower and higher daily-volatility values to see how the floor changes with the candidate's own volatility.
This is why customers should care: the replacement is not "close enough, probably." It is a structured attempt to preserve exposure and avoid obvious own-goals.
Artificial intelligence is used with guardrails, not as a magic trick
How does HarvestEngine use AI in the ranking process while preventing inconsistent or unpredictable outputs?
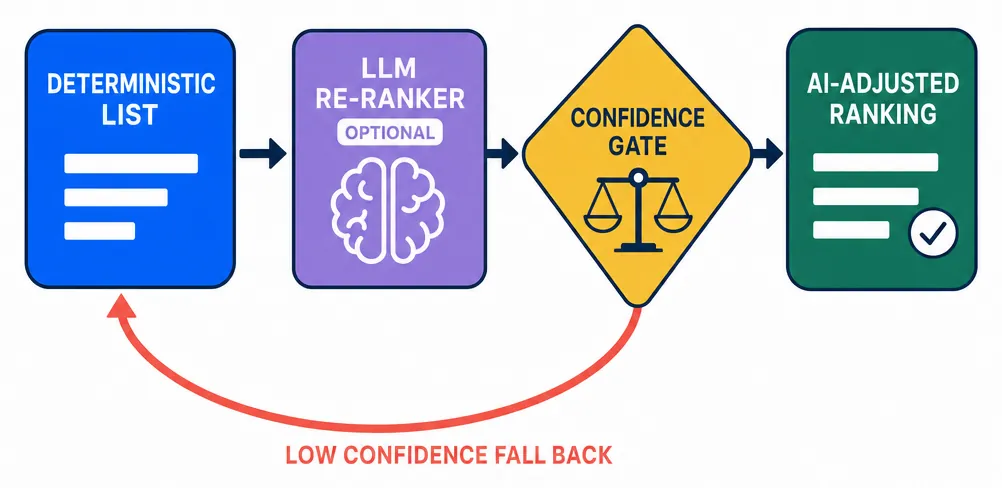
HarvestEngine does use a language model as an optional re-ranker on top of the deterministic candidate list. But it does so with two important protections:
- Deterministic cache: the same input set returns the same output, rather than a new whimsical ranking each time
- Confidence gate: if the model is not confident enough, the system falls back to the deterministic ranking
That matters because customers should never have to wonder whether the product is making different decisions on the same facts just because a model felt different today.
The short sleeve is academically grounded, not just the inverse of the long model
Why does HarvestEngine use a separate academically grounded model for short candidates rather than inverting the long ranking?
For advanced users, HarvestEngine also has a gated short-overlay path. This is important because many systems make the lazy mistake of assuming the worst long ideas are automatically the best shorts. Academic evidence says that is not good enough.
Instead, the short sleeve uses a dedicated model led by price trend and three accounting-quality signals, with volatility used as a risk control rather than a reason to short:
- Momentum (12-minus-1): has the stock been falling over the past year? It is the trailing twelve-month return, skipping the most recent month to avoid short-term bounces, sign-flipped so the biggest losers score highest. This is the heaviest leg — the accounting signals below only pay off when you are not shorting a winner (Jegadeesh & Titman 1993, Journal of Finance)
- Accruals: are earnings being flattered by working-capital accounting rather than cash (Sloan 1996, The Accounting Review)
- Net issuance: is the company quietly diluting shareholders by printing new shares (Pontiff & Woodgate 2008, Journal of Finance)
- Beneish M-score: do the accounting statements look suspicious enough to deserve caution (Beneish 1999, Financial Analysts Journal)
Idiosyncratic volatility — how noisy a stock is once the broad-market move is stripped out — is not scored as a reason to short. For a concentrated single-name short, high noise means squeeze and borrow risk, so it is used to dial down conviction on the jumpiest names rather than reward them (Ang-Hodrick-Xing-Zhang 2006, Journal of Finance).
Show the Beneish M-score formula (8 ratios)
+ 0.115·DEPI − 0.172·SGAI + 4.679·TATA − 0.327·LVGI
Show the idiosyncratic-volatility regression
Step 2 — IVol = σ(ε)
Most customers will never use this sleeve, and that is fine. The reason it still matters is what it says about product philosophy: the engine does not fake sophistication by calling the bottom of the long rank a short book. It uses a separate model when the problem changes.
The tax gates are part of the product, not an afterthought
How does HarvestEngine build tax-compliance rules into the engine rather than treating them as an afterthought?
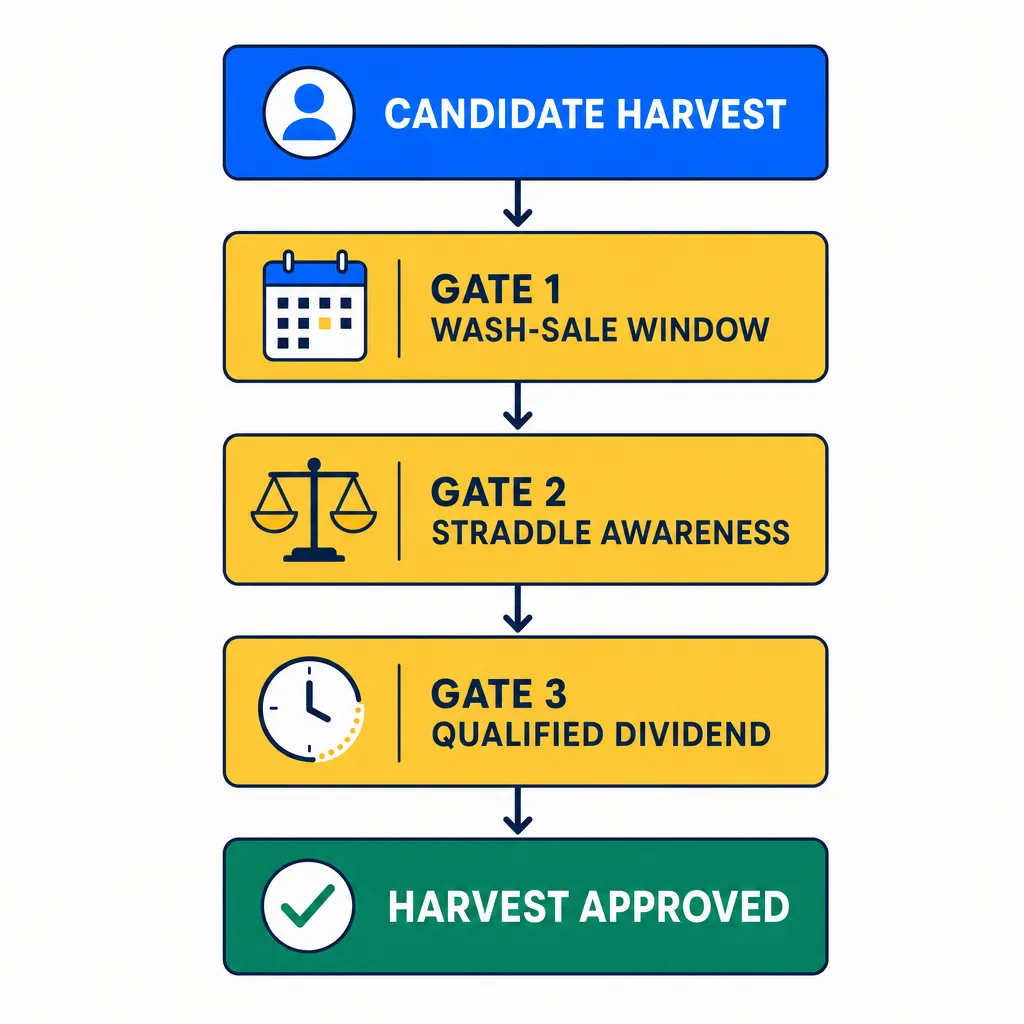
Customers should especially care about this part. Many tools make attractive promises about potential tax savings without showing how the rule layer works. HarvestEngine builds rule gates directly into the engine.
That includes wash-sale awareness on the long side, straddle-aware checks, and caution around qualified-dividend timing issues in the advanced overlay. The point is not to show off tax-code trivia. The point is that a harvest is only useful if it stands up when you look back at it later.
Two honesty notes worth stating plainly. First, the wash-sale window is 61 days — the 30 days before a sale, the day itself, and the 30 days after — and it reaches across all of your accounts, including IRAs and a spouse's accounts. HarvestEngine applies its checks across the accounts it can see; it cannot see a broker you have not connected, so the final call still belongs to you and your tax advisor. Second, "substantially identical" is an IRS judgment standard with no official safe-harbor list — the engine takes the conservative practitioner view, treating same-index funds as off-limits (see what counts as substantially identical), but conservative is not the same as guaranteed.
The algorithm writes an audit trail
Why is the audit trail one of the most practical differentiators in HarvestEngine's design?
This may be the most practical differentiator of all.
Each important decision can be logged with its provenance: why the candidate survived, why another candidate was dropped, what score the replacement received, and which risk gates were active. That means the customer is not just buying automation. They are buying something closer to inspectable decision infrastructure.
That is a very different experience from a product that simply says, "Trust us, we optimized it."
So why should a customer care?
Why does the quality of the underlying algorithm determine whether a TLH product is worth trusting with real assets?
Because the algorithm determines whether the product is just convenient or actually worth trusting with meaningful taxable assets.
A stronger engine means:
- better odds that harvested losses are meaningful, not noisy
- better replacements after a sale
- fewer dumb exposure changes
- fewer tax-rule mistakes
- clearer explanations when you want to know why the product acted
In other words, the algorithm is not a technical curiosity. It is the thing turning a tax-loss harvesting app into a tax-aware portfolio system.
The simple takeaway
What is the simplest case for why the algorithm behind a TLH product matters more than its interface?
Most products want you to trust the interface. HarvestEngine wants to be the first product where a thoughtful customer can trust the engine too.
That is why the algorithm matters. Not because it sounds advanced, but because it makes the product more understandable, more auditable, and more defensible when real money and real taxes are involved.
Read this next with TLH 101, why big firms push TLH, and how HarvestEngine uses AI without pretending to be your adviser.